Market Equilibrium And Determination Of Equilibrium Price And Quantity
Introduction
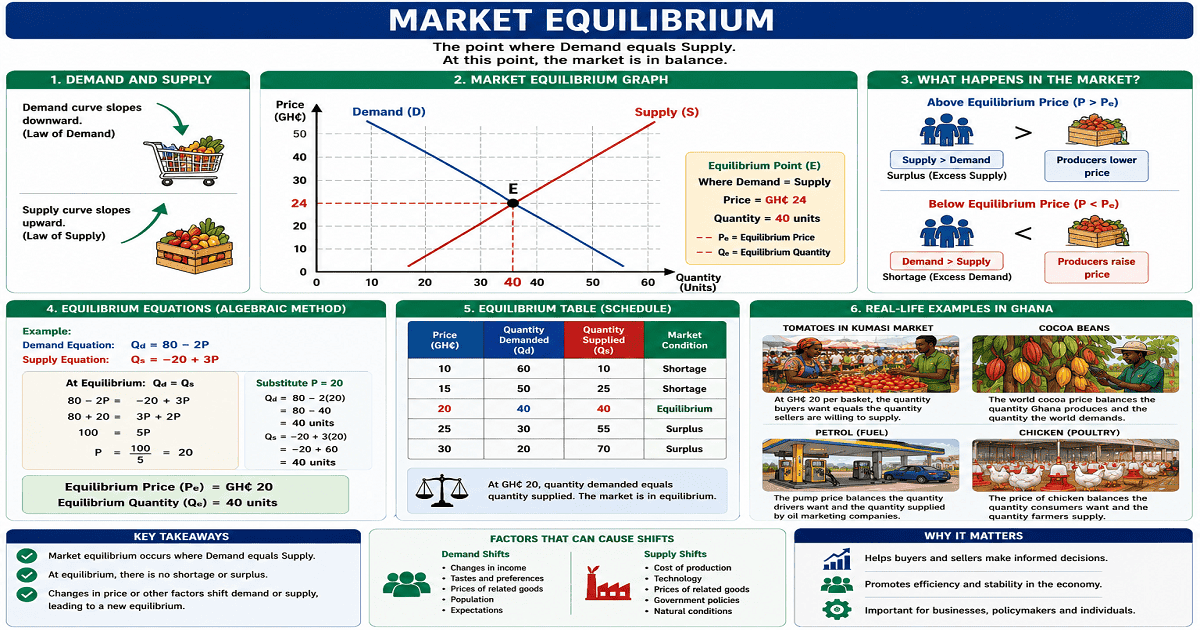
Market equilibrium is a condition in which the quantity of goods supplied is equal to the quantity of goods demanded. At this point, the market reaches a stable price and quantity because there is neither excess supply nor excess demand. Market equilibrium helps economists, producers, and consumers understand how prices and quantities are determined in competitive markets.
Key Concepts
- Market Equilibrium: A condition where quantity demanded equals quantity supplied.
- Demand: The quantity of a product or service consumers are willing and able to purchase at various prices.
- Supply: The quantity of a product or service producers are willing and able to sell at various prices.
- Equilibrium Price: The price at which quantity demanded equals quantity supplied.
- Equilibrium Quantity: The amount of goods bought and sold at the equilibrium price.
- Demand Function: A mathematical expression showing the relationship between price and quantity demanded.
- Supply Function: A mathematical expression showing the relationship between price and quantity supplied.
- Equilibrium Condition: Qd = Qs.
Explanation
Market equilibrium occurs when the quantity of goods consumers are willing to buy is exactly equal to the quantity producers are willing to sell. At this point, the market reaches a stable condition where there is no tendency for price to rise or fall.
The equilibrium price is the price at which quantity supplied equals quantity demanded, while the equilibrium quantity is the amount bought and sold at that price.
Graphically, market equilibrium occurs at the point where the demand curve intersects the supply curve. The equilibrium point identifies both the equilibrium price and equilibrium quantity.
The equilibrium condition can also be expressed mathematically:
Qd = Qs
Where:
- Qd = Quantity Demanded
- Qs = Quantity Supplied
General demand and supply functions may be expressed as:
Demand Function: Qd = a − bP
Supply Function: Qs = c + dP
At equilibrium:
Qd = Qs
To determine equilibrium price and quantity using algebra, economists set the demand function equal to the supply function and solve for price. The resulting price is substituted into either equation to determine equilibrium quantity.
Consider the following functions:
Demand Function: Qd = 100 − 2P
Supply Function: Qs = 20 + 3P
Step 1: Set Qd = Qs
100 − 2P = 20 + 3P
Step 2: Solve for P
100 − 20 = 3P + 2P
80 = 5P
P = 80 / 5
P = 16
Therefore, the equilibrium price is 16.
Step 3: Substitute P = 16 into the demand function:
Qd = 100 − 2(16)
Qd = 100 − 32
Qd = 68
Using the supply function:
Qs = 20 + 3(16)
Qs = 20 + 48
Qs = 68
Therefore, the equilibrium quantity is 68 units.
Verification confirms that both functions produce the same quantity when P = 16. Therefore, the equilibrium price is 16 and the equilibrium quantity is 68.
Components Of Market Equilibrium
| Concept | Description | Role In Equilibrium |
|---|---|---|
| Demand | Consumer willingness to buy | Determines quantity demanded |
| Supply | Producer willingness to sell | Determines quantity supplied |
| Equilibrium Price | Price where Qd = Qs | Creates market balance |
| Equilibrium Quantity | Quantity traded at equilibrium | Represents market output |
Algebraic Determination Of Equilibrium
| Step | Procedure | Result |
|---|---|---|
| 1 | Set Qd = Qs | 100 − 2P = 20 + 3P |
| 2 | Solve for P | P = 16 |
| 3 | Substitute into demand function | Qd = 68 |
| 4 | Verify using supply function | Qs = 68 |
Market Equilibrium Relationships
| Condition | Relationship | Outcome |
|---|---|---|
| Qd = Qs | Demand equals supply | Market equilibrium |
| Qd > Qs | Demand exceeds supply | Shortage |
| Qd < Qs | Supply exceeds demand | Surplus |
Examples
Example 1
Problem: Determine the equilibrium price from the functions Qd = 100 − 2P and Qs = 20 + 3P.
- Set Qd = Qs.
- 100 − 2P = 20 + 3P.
- 80 = 5P.
- P = 16.
Final Answer: The equilibrium price is 16.
Example 2
Problem: Determine the equilibrium quantity when P = 16.
- Substitute P = 16 into Qd = 100 − 2P.
- Qd = 100 − 32.
- Qd = 68.
- Verify using Qs = 20 + 3(16) = 68.
Final Answer: The equilibrium quantity is 68 units.
Application and Activities
- Draw demand and supply curves to identify equilibrium points.
- Use algebra to determine equilibrium price and quantity.
- Compare equilibrium conditions in different markets.
- Analyse market situations where shortages and surpluses occur.
Practice Questions
- Define market equilibrium.
- Explain the meaning of equilibrium price and equilibrium quantity.
- Using Qd = 500 − 10P and Qs = 100 + 5P, determine the equilibrium price and quantity.
Summary
Market equilibrium occurs when quantity demanded equals quantity supplied. The equilibrium price is the price at which this balance occurs, while the equilibrium quantity is the amount traded at that price. Equilibrium can be illustrated using graphs and determined mathematically by setting Qd equal to Qs. Understanding market equilibrium helps explain how prices and quantities are established in markets and how resources are allocated efficiently.
Access NaCCA-aligned Support Packs
Download your structured NaCCA-aligned Teacher Support Pack and Student Learning Pack, designed for clarity, practicality, and reliable teaching and learning.