
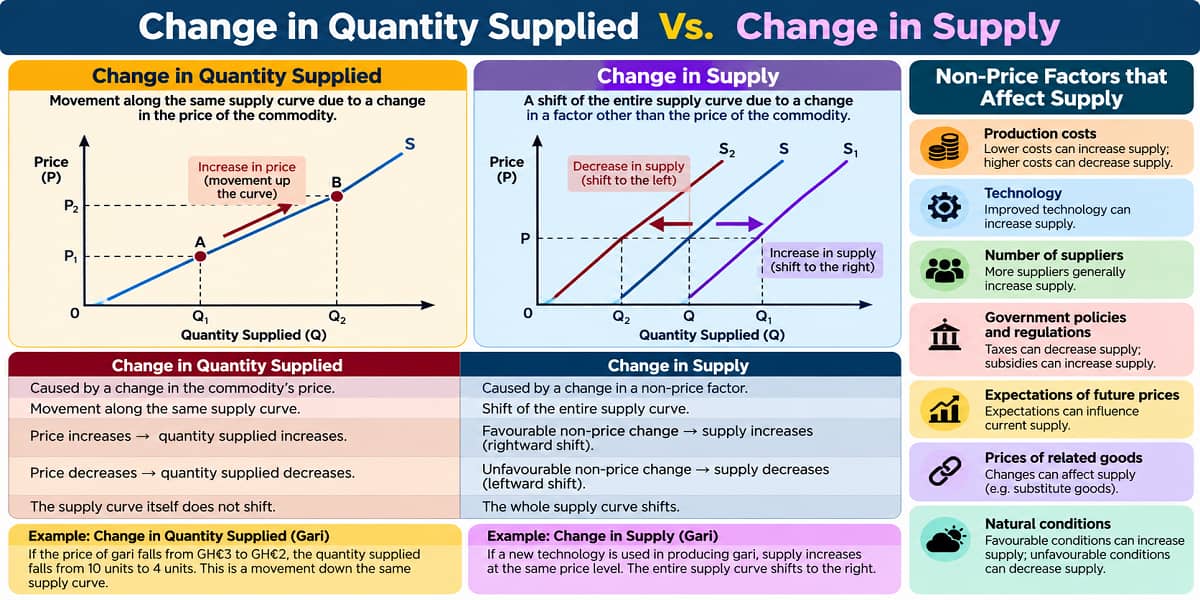
Change in Quantity Supplied Vs. Change in Supply Explained for SHS 2 Economics (Sem. 1 – Week 12)
Two supply graphs can look similar, yet represent very different economic events. The difference comes down to one question: What caused the change?
When Price Is the Cause
Suppose the price of a commodity changes while other factors remain constant. Producers respond by changing the quantity they are willing and able to supply.
This is a change in quantity supplied. The supply curve remains where it is; the producer moves from one point to another on that curve.
The Gari Example
The distinction becomes concrete with gari. If its price falls from GH₵3 to GH₵2 and the quantity supplied falls from 10 units to 4 units, the supply curve does not move. The change is represented by movement down the same curve.
When Something Other Than Price Changes
Now consider a different situation. The commodity’s price stays the same, but the conditions facing producers change.
This is a change in supply. Instead of moving along one curve, the entire supply curve shifts.
| Non-price factor | How it can affect supply |
|---|---|
| Production costs | Changes in production costs can alter supply. |
| Technology | Improved technology can increase supply. |
| Number of suppliers | Changes in the number of suppliers can alter market supply. |
| Government policies and regulations | Policies can affect the conditions under which producers operate. |
| Expectations of future prices | Expectations can influence current supply. |
| Prices of related goods | Changes can affect the supply of the commodity. |
| Natural conditions | Favourable or unfavourable conditions can affect supply. |
Movement or Shift?
The easiest way to remember the distinction is to connect each cause to its graphical result.
| Cause | Economic concept | Graphical result |
|---|---|---|
| Commodity’s own price increases | Change in quantity supplied | Movement up the same curve |
| Commodity’s own price decreases | Change in quantity supplied | Movement down the same curve |
| Favourable non-price change | Increase in supply | Rightward shift |
| Unfavourable non-price change | Decrease in supply | Leftward shift |
Technology: A Useful Contrast
Imagine that producers begin using a new technology to produce gari. This is not a change in the price of gari. It is a change in a non-price factor.
If the technology improves production conditions, supply may increase at the same price. The entire supply curve therefore shifts to the right.
Three Questions to Ask in an Exam
- What changed? Identify the situation.
- Was it the commodity’s own price? If yes, think change in quantity supplied.
- Was it a non-price factor? If yes, think change in supply.
Test Your Understanding
1. The price of a commodity increases. Is this a change in supply?
No. It is a change in quantity supplied, represented by movement along the same supply curve.
2. A producer adopts improved technology. Is this a change in quantity supplied?
No. It is a change in supply because technology is a non-price factor.
3. What happens when supply increases?
The entire supply curve shifts to the right.
4. What happens when supply decreases?
The entire supply curve shifts to the left.
Why the Distinction Matters
Both concepts describe changes in the quantity producers supply, but they tell different economic stories. A movement along the curve tells us that the commodity’s own price changed. A shift tells us that something else changed the conditions of supply.
Once the cause is identified, the graph becomes much easier to interpret.
Key Takeaway
Price change → change in quantity supplied → movement along the same supply curve.
Non-price change → change in supply → shift of the entire supply curve.
Access NaCCA-aligned Support Packs
Download your structured NaCCA-aligned Teacher Support Pack and Student Learning Pack, designed for clarity, practicality, and reliable teaching and learning.