Supply: Price, Quantity Supplied and Other Factors
1. What Is Supply?
Supply refers to the total amount of a specific good or service that producers are willing and able to supply at different prices over a given period.
The relationship between price and quantity supplied is represented by a supply curve. A typical supply curve slopes upward because higher prices generally encourage producers to supply more.
2. Price and Quantity Supplied
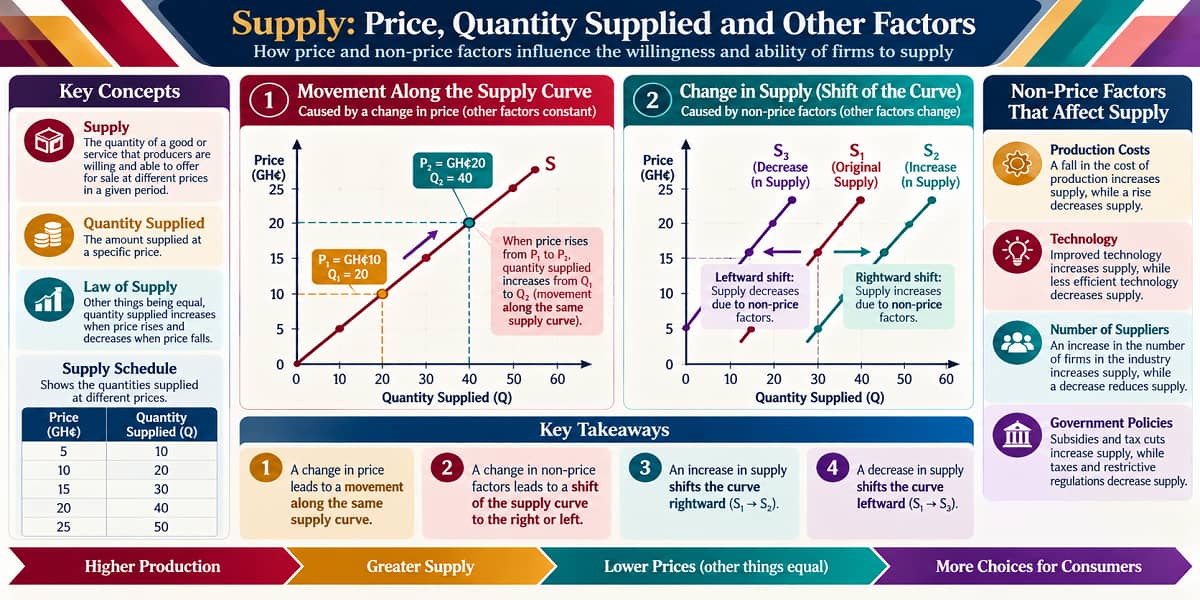
A change in the price of the commodity itself causes a change in quantity supplied. The result is a movement along the same supply curve.
| Price | Quantity Supplied | Movement |
|---|---|---|
| GH₵10 | 2 | Starting point |
| GH₵20 | 5 | Up the supply curve |
| GH₵30 | 8 | Further up the supply curve |
| GH₵40 | 12 | Further up the supply curve |
Therefore:
- Price increases → quantity supplied increases.
- Price decreases → quantity supplied decreases.
- The movement remains on the same supply curve.
3. Change in Quantity Supplied vs Change in Supply
These two ideas must not be confused.
| Change in Quantity Supplied | Change in Supply |
|---|---|
| Caused by a change in the commodity’s own price. | Caused by a change in a non-price factor. |
| Movement along the same supply curve. | Shift of the entire supply curve. |
| Higher price generally increases quantity supplied. | Supply may increase or decrease depending on the factor. |
4. Other Factors Affecting Supply
Supply can change even when the commodity’s own price remains unchanged. These are non-price factors. The source identifies production costs, technological advances, number of suppliers and government policies among the factors affecting supply.
Production Costs
Changes in the costs of inputs such as labour, raw materials and technology can affect supply. When production costs decrease, supply may increase because production becomes more profitable.
Technological Advances
Improved technology can make production more efficient and increase the supply of goods and services. This causes the supply curve to shift to the right.
Number of Suppliers
An increase in the number of producers in a market generally leads to an increase in supply.
Government Policies
Taxes, subsidies and regulations can affect supply. A subsidy may increase supply by reducing production costs, while a tax may decrease supply by increasing costs.
5. What Is a Change in Supply?
A change in supply occurs when the entire supply curve shifts because of a change in a non-price determinant of supply.
At a given price:
- Increase in supply → supply curve shifts to the right.
- Decrease in supply → supply curve shifts to the left.
6. Think Through the Difference
Situation A: The price of a commodity rises. Producers respond by supplying more.
Answer: This is a change in quantity supplied because the commodity’s own price changed. There is movement along the same supply curve.
Situation B: Production costs fall while the commodity’s price remains unchanged.
Answer: This is a change in supply because a non-price factor changed. The supply curve shifts.
7. A Simple Graphing Guide
- Draw the vertical axis and label it Price.
- Draw the horizontal axis and label it Quantity or Quantity Supplied.
- For a change in quantity supplied, draw one upward-sloping supply curve and show movement between two points on it.
- For a change in supply, draw the original supply curve and a second curve shifted to the right or left.
- Use arrows to show the direction of movement or shift.
- Label the curves and points clearly.
8. Apply the Ideas
- The price of a product increases. What happens?
Quantity supplied generally increases through movement up the same supply curve. - The price of a product decreases. What happens?
Quantity supplied generally decreases through movement down the same supply curve. - A new technology makes production more efficient. What happens?
Supply increases and the supply curve shifts to the right. - A tax increases production costs. What happens?
Supply decreases because production costs increase, causing a shift of the supply curve to the left. - More producers enter the market. What happens?
Supply generally increases.
9. Quick Check
Question: What is the main test for distinguishing a change in quantity supplied from a change in supply?
Answer: Ask what caused the change. If the commodity’s own price changed, it is a change in quantity supplied and movement occurs along the same curve. If a non-price factor changed, it is a change in supply and the entire curve shifts.
10. Summary
Supply describes the quantity producers are willing and able to supply at different prices. A change in the commodity’s own price causes a movement along the supply curve. Changes in non-price factors such as production costs, technology, number of suppliers and government policies cause a shift of the entire supply curve. An increase in supply shifts the curve to the right, while a decrease shifts it to the left.
Access NaCCA-aligned Support Packs
Download your structured NaCCA-aligned Teacher Support Pack and Student Learning Pack, designed for clarity, practicality, and reliable teaching and learning.