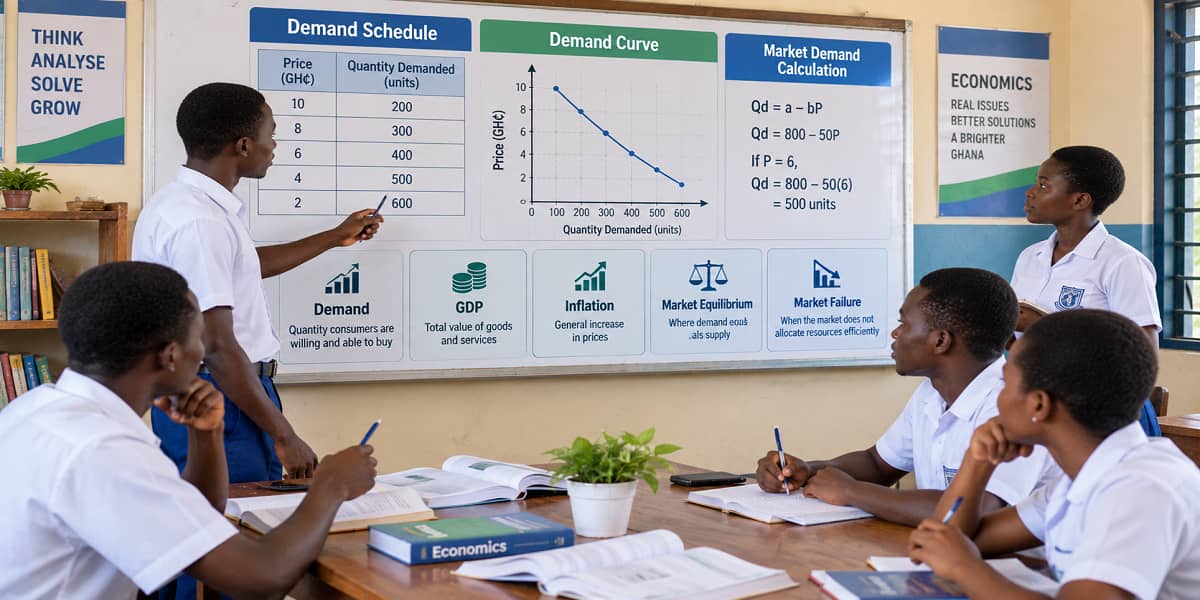
Tools in Economic Analysis: Words and Infographics
Economics deals with ideas such as demand, inflation, productivity and market equilibrium. To communicate and analyse these ideas clearly, economists use different economic tools.
Two important tools are words and infographics.
1. Economic Tools
Economic tools are methods, techniques or instruments used to analyse economic data, understand economic phenomena and make decisions.
This lesson focuses on two of them:
- Words (economese) — specialised economic language.
- Infographics — visual representations of information, data or knowledge.
2. Words as an Economic Tool
Economese refers to the specialised language and jargon used by economists, policymakers, financial analysts and other professionals in Economics.
It includes technical terms, abbreviations, phrases and complete statements that have specific meanings within Economics.
A key point is that an economic word may have a meaning that differs from its everyday meaning.
Example: Demand
In everyday language, demand can mean an insistent request made as a right.
In Economics, demand refers to the quantity of a good or service that consumers are willing and able to purchase at various prices over a given period.
The economic meaning is therefore more precise.
3. Words Can Express Economic Relationships
Economists can also use complete sentences to describe relationships.
For example, the law of demand states:
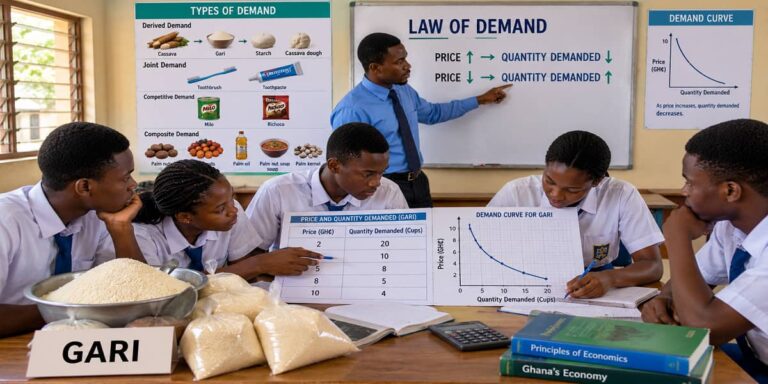
All things being equal, the higher the price of a commodity or service, the lower the quantity demanded; and the lower the price, the higher the quantity demanded.
The sentence communicates a relationship between price and quantity demanded.
4. Examples of Economese
| Economic term | Meaning |
|---|---|
| Gross Domestic Product (GDP) | A measure of the total economic output of a country. |
| Inflation | The rate at which the general level of prices for goods and services is rising. |
| Unemployment rate | The percentage of the labour force that is without work but actively seeking employment. |
| Market equilibrium | A state in which the supply of a good or service matches its demand. |
| Market failure | A situation in which a market operating on its own does not allocate resources efficiently, leading to a loss of economic and social welfare. |
5. Try the Economic Language
Read this statement:
“The unemployment rate has increased.”
The word unemployment rate does not simply mean “people without jobs.” It has a specific economic meaning: the percentage of the labour force that is without work but actively seeking employment.
This precision is what makes economese useful in economic analysis.
6. Infographics as an Economic Tool
Infographics are visual representations of information, data or knowledge designed to present complex information quickly and clearly.
They can use charts, graphs and maps to communicate economic trends, comparisons and distributions.
They can also simplify economic theories, models and relationships so that they can be understood more easily.
7. Why Use Infographics?
Economic information can sometimes contain large amounts of data or complicated relationships. An infographic can help the reader see the important pattern quickly.
Infographics can therefore help to:
- present complex information clearly;
- illustrate economic trends;
- show comparisons;
- display distributions;
- simplify economic relationships; and
- communicate economic findings and insights.
8. Individual Demand as an Infographic
Consider Kwame’s monthly demand for Gobe (Gari and Beans):
| Price (GH₵) | Quantity Demanded (Bowls) |
|---|---|
| 5 | 10 |
| 7 | 8 |
| 12 | 7 |
| 15 | 5 |
| 20 | 3 |
| 26 | 2 |
| 30 | 1 |
As price rises from GH₵5 to GH₵30, quantity demanded falls from 10 bowls to 1 bowl. The schedule therefore provides information that can be represented visually.
9. Market Demand
Market demand is the total quantity of a good or service that all consumers in a market are willing and able to purchase at various prices during a specific period.
Market demand is obtained by summing the individual quantities demanded at each price.
Worked Example
Four consumers demand gari as follows:
| Price (GH₵) | Esi | Adwoa | Yaw | Fiifi | Market Demand |
|---|---|---|---|---|---|
| 10 | 10 | 12 | 8 | 7 | 37 |
| 18 | 7 | 10 | 7 | 5 | 29 |
| 22 | 5 | 7 | 5 | 4 | 21 |
| 30 | 3 | 5 | 3 | 2 | 13 |
| 35 | 2 | 3 | 1 | 1 | 7 |
| 42 | 1 | 2 | 0.5 | 0.5 | 4 |
At GH₵10:
Market demand = 10 + 12 + 8 + 7 = 37 bowls.
At GH₵30:
Market demand = 3 + 5 + 3 + 2 = 13 bowls.
The same addition is performed at every price.
10. From Individual Demand to Market Demand
11. Infographics Can Explain Supply Too
The same visual approach can be applied to supply.
Suppose six maize sellers supply the following quantities:
| Price (GH₵) | Araba | Aseye | Naa | Bawa | Opoku | Yidana | Market Supply |
|---|---|---|---|---|---|---|---|
| 2 | 0 | 1 | 2 | 3 | 4 | 5 | 15 |
| 4 | 1 | 2 | 3 | 4 | 5 | 6 | 21 |
| 6 | 2 | 3 | 4 | 5 | 6 | 7 | 27 |
| 8 | 3 | 4 | 5 | 6 | 7 | 8 | 33 |
| 10 | 4 | 5 | 6 | 7 | 8 | 9 | 39 |
For example, at GH₵6:
Market supply = 2 + 3 + 4 + 5 + 6 + 7 = 27 bowls.
At GH₵10:
Market supply = 4 + 5 + 6 + 7 + 8 + 9 = 39 bowls.
These totals can then be plotted to construct the market supply curve.
12. Individual and Market Curves
An individual demand or supply curve represents the behaviour of one consumer or seller. A market curve represents the combined quantities of all consumers or sellers at each price.
| Curve | What it represents |
|---|---|
| Individual demand | Quantity demanded by one consumer at different prices. |
| Market demand | Total quantity demanded by all consumers at different prices. |
| Individual supply | Quantity supplied by one seller at different prices. |
| Market supply | Total quantity supplied by all sellers at different prices. |
13. Practice
Question 1: What is economese?
Answer: It is the specialised language and jargon used in Economics.
Question 2: What is an infographic?
Answer: It is a visual representation of information, data or knowledge intended to communicate complex information quickly and clearly.
Question 3: Four consumers demand 5, 6, 4 and 3 bowls at a particular price. Calculate market demand.
Answer: 5 + 6 + 4 + 3 = 18 bowls.
Question 4: Six sellers supply 2, 3, 4, 5, 6 and 7 bowls. Calculate market supply.
Answer: 2 + 3 + 4 + 5 + 6 + 7 = 27 bowls.
14. Think and Apply
When you encounter an economic issue, first ask:
- What economic terms describe the issue?
- What does each term mean precisely?
- Can the information be represented visually?
- Would a table, graph, chart or map make the relationship easier to understand?
This approach combines the precision of economese with the clarity of infographics.
15. Final Synthesis
Words give economists a precise vocabulary for describing concepts, theories, processes and phenomena.
Infographics transform information and data into visual forms that can make trends, comparisons, distributions and relationships easier to understand.
Market demand is obtained by summing individual demand, while market supply is obtained by summing individual supply at each price.
Remember: words explain economic meaning; infographics make economic information visible.
Access NaCCA-aligned Support Packs
Download your structured NaCCA-aligned Teacher Support Pack and Student Learning Pack, designed for clarity, practicality, and reliable teaching and learning.