Change in Quantity Demanded vs. Change in Demand Explained for SHS 2 Economics (Sem. 1 – Week 4)
Imagine that the price of a commodity falls and people buy more of it. Now imagine that the price stays exactly the same, but people suddenly want more of it. Both situations involve demand, but they are not the same economic change.
The Question That Solves the Confusion
Whenever demand changes, begin with one question:
Did the price of the commodity itself change?
If yes, the change is in quantity demanded. If no, and another demand factor changed, the result is a change in demand.
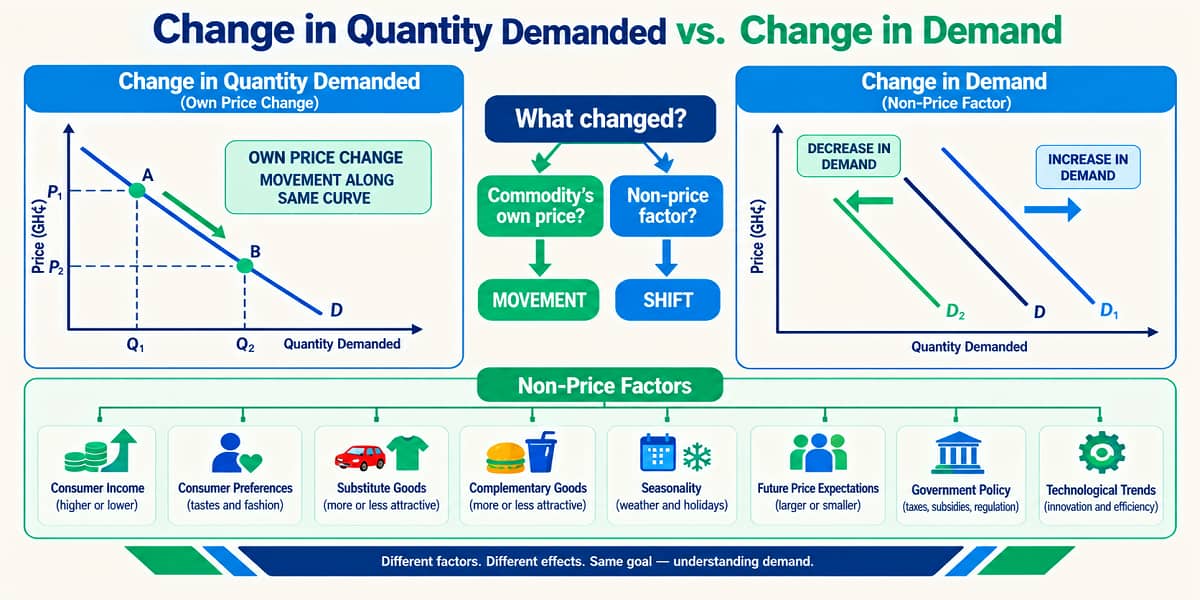
When Price Changes: Movement
Suppose the price of baobab falls from GH₵3 to GH₵2. Quantity demanded rises from 10 units to 15 units.
Nothing has happened to the demand curve itself. The consumer has moved from one point to another on the same curve.
This is called a change in quantity demanded.
When Something Else Changes: Shift
Now consider a different situation. The price remains unchanged, but consumer income increases and demand for a normal good rises.
The explanation is different because price did not cause the change. Income changed.
The entire demand curve therefore shifts to the right.
If an unfavourable non-price change reduces demand, the entire curve shifts to the left.
Movement and Shift Side by Side
| Question | Movement | Shift |
|---|---|---|
| What changed? | Own price | A non-price factor |
| What changes? | Quantity demanded | Demand |
| What happens graphically? | Movement on one curve | Entire curve shifts |
| Possible direction | Up or down | Right or left |
The Main Non-Price Factors
A change in demand can arise from several sources.
Income
For normal goods, an increase in income increases demand. For inferior goods, an increase in income decreases demand.
Tastes and Preferences
If consumers develop a stronger preference for a commodity, its demand can increase. A reduction in preference can decrease demand.
Prices of Related Goods
Related goods include substitutes and complements.
A rise in the price of a substitute can increase demand for the commodity being considered. A rise in the price of a complement can decrease its demand.
Expectations
If consumers expect prices to rise in the future, they may buy more now. If they expect prices to fall, they may postpone purchases.
Number of Buyers
An increase in the number of consumers in a market can increase demand. A decrease can reduce demand.
Other External Factors
Government policies and other external influences can also affect demand. The important point is that these factors operate differently from a change in the commodity’s own price.
A Textbook Example
Consider students purchasing an Economics textbook.
Situation 1: The price falls from GH₵50 to GH₵40, and students buy more textbooks.
This is a change in quantity demanded because the textbook’s own price changed.
Situation 2: The price remains GH₵50, but students’ incomes rise and more textbooks are demanded.
This is a change in demand because income changed.
The same commodity can therefore experience either type of change, depending on the factor responsible.
Reading the Graph Correctly
A common mistake is to see any change in quantity and immediately call it a “change in demand”. In economic analysis, the graph provides an important clue.
- Same curve, different point: change in quantity demanded.
- New position of the entire curve: change in demand.
Three Quick Scenarios
Scenario 1: The price of a commodity rises.
Result: Quantity demanded falls; movement up the same demand curve.
Scenario 2: Consumer income rises for a normal good.
Result: Demand increases; the demand curve shifts right.
Scenario 3: The price of a complementary good rises.
Result: Demand for the commodity decreases; the demand curve shifts left.
Remember This Rule
Think of the demand curve as a road.
If you travel to another point on the same road, you have movement along the curve.
If the entire road moves to a new position, you have a shift of the curve.
In Economics:
Price of the commodity → movement.
Other demand factors → shift.
Final Takeaway
Change in quantity demanded is caused by a change in the commodity’s own price and is represented by movement along the same demand curve.
Change in demand is caused by changes in non-price factors and is represented by a shift of the entire demand curve.
Learning to identify the cause before interpreting the graph is the key to distinguishing the two concepts.
Access NaCCA-aligned Support Packs
Download your structured NaCCA-aligned Teacher Support Pack and Student Learning Pack, designed for clarity, practicality, and reliable teaching and learning.