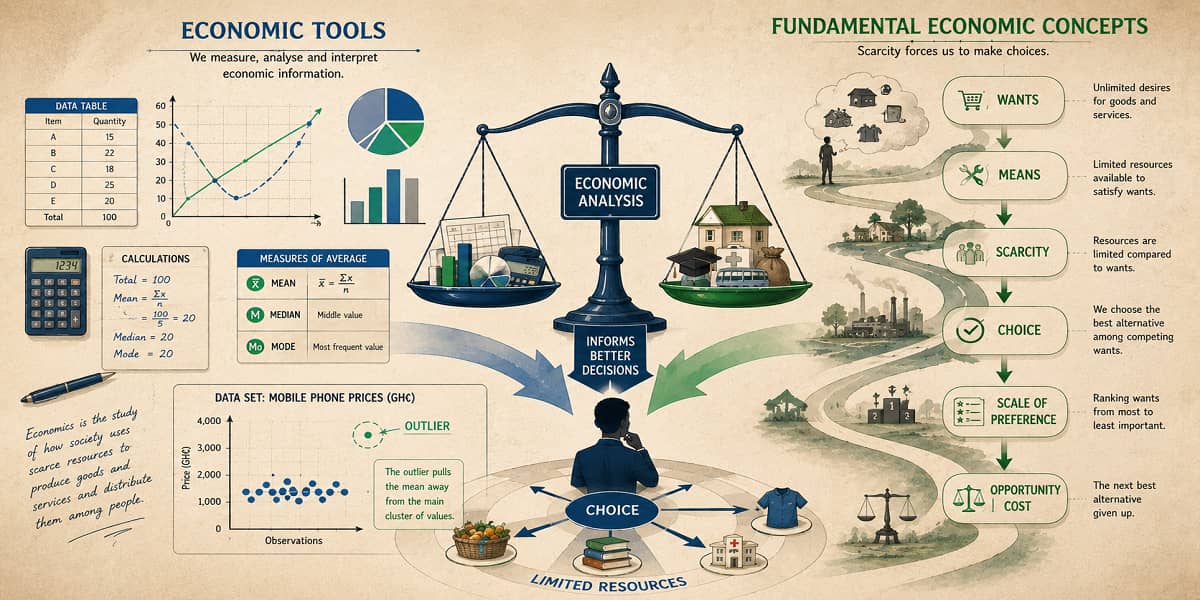
Economic Tools and Fundamental Economic Concepts
Economics uses a language of words, graphs, tables, mathematics and statistical tools to describe relationships, analyse information and understand economic problems.
This lesson develops two connected areas of economic thinking. First, we examine the tools economists use to communicate and analyse information. We then apply economic thinking to fundamental concepts such as wants, means, scarcity, choice, scale of preference and opportunity cost.
1. What Are Economic Tools?
Economic tools are the analytical methods, models and techniques used to study, analyse and understand economic phenomena.
Economic analysis is the process of examining economic data, theories, models and policies to understand how economic systems function, predict future outcomes and evaluate the effects of decisions and interventions.
Economic analysis can be applied to issues such as:
- market behaviour;
- policy effectiveness;
- resource allocation; and
- economic performance.
2. The Language of Economics
Economists communicate ideas through different forms. Words explain concepts and arguments, while graphs, charts, tables, mathematics and statistical measures help organise and analyse information.
The main tools introduced in this lesson are:
- words;
- graphs;
- charts;
- tables;
- averages such as mean, median and mode;
- mathematical models; and
- software applications.
3. Words as an Economic Tool
Words are an important means of communicating economic ideas.
Economists, policymakers, advertisers, journalists, educators and individuals use words to communicate economic concepts, formulate policies, influence behaviour and facilitate economic transactions.
The effective use of economic language can influence:
- market sentiment;
- consumer choices;
- investment decisions;
- policy debates; and
- public understanding of economic concepts.
Words can therefore do more than describe economic events. They can also communicate arguments, persuade people and shape economic behaviour.
4. Graphical Tools
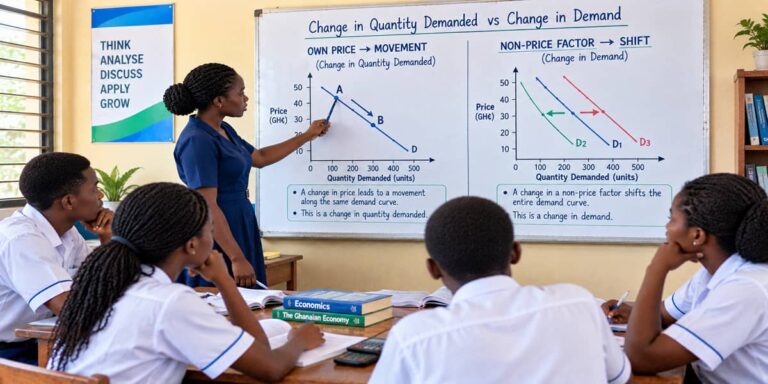
Graphical tools provide visual representations of economic relationships.
A graph can make a complex relationship easier to see and understand. It can help economists communicate ideas, theories and findings more effectively.
Examples include:
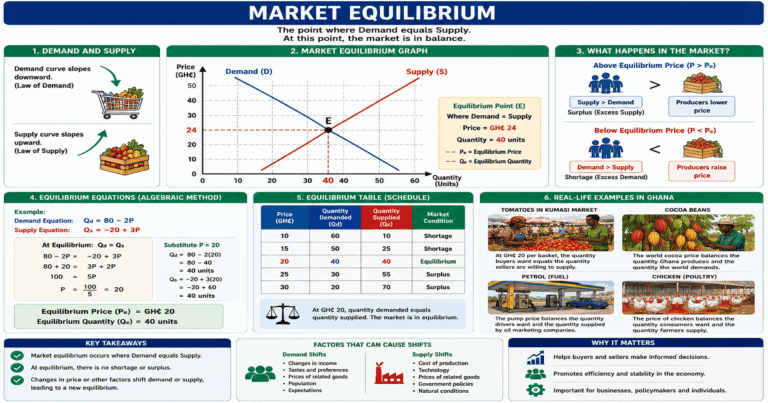
- supply and demand curves;
- production possibility curves;
- market structure diagrams; and
- cost curves.
A graph is particularly useful when you want to see how variables relate to one another rather than reading the information only in words.
5. Charts
Charts organise information visually so that patterns and differences can be recognised more easily.
Common forms include:
- bar charts;
- line charts;
- pie charts; and
- pictograms.
The choice of chart should depend on the type of information being presented.
6. Tables
A table arranges information systematically in rows and columns.
Tables are useful when exact values need to be displayed or compared. They can also provide the data from which graphs and statistical calculations are produced.
For example, a table can show how many learners received different types of fruit in a class.
7. Statistical and Mathematical Tools
Statistical tools help economists analyse data, test hypotheses and make informed decisions.
They help identify:
- patterns;
- relationships; and
- trends in economic variables.
Statistical analysis provides a systematic approach to drawing meaningful conclusions. It can support policy recommendations, economic forecasting and evaluation of interventions.
8. Descriptive Statistics
Descriptive statistics summarise and describe data, giving a clear overview of its characteristics.
One important group of descriptive statistics is the measures of central tendency:
- mean;
- median; and
- mode.
9. The Mean
The mean is obtained by adding all the values and dividing the total by the number of values.
The basic formula is:
Mean = Sum of values ÷ Number of values
For the fruit distribution below, there are nine fruit categories and the total frequency is 40:
| Fruit | Frequency |
|---|---|
| Orange | 4 |
| Mango | 5 |
| Banana | 4 |
| Pear | 5 |
| Pawpaw | 5 |
| Coconut | 5 |
| Watermelon | 5 |
| Pineapple | 5 |
| Sheanut | 2 |
| Total | 40 |
Mean = 40 ÷ 9 = 4.4 approximately.
10. The Median
The median is the middle value when a set of values is arranged in order.
Arrange the fruit frequencies from lowest to highest:
2, 4, 4, 5, 5, 5, 5, 5, 5
There are nine values, so the fifth value is the middle value.
Therefore:
Median = 5
11. The Mode
The mode is the value that occurs most frequently.
In the fruit distribution, the value 5 appears six times.
Therefore:
Mode = 5
12. Why Are the Median and Mode Both 5?
The median is 5 because 5 occupies the middle position when the values are arranged in order.
The mode is also 5 because 5 occurs more frequently than any other value.
They therefore happen to have the same value in this particular data set, although median and mode measure different things.
13. Mean, Median and Mode Compared
| Measure | Meaning | Fruit Example |
|---|---|---|
| Mean | Sum of values divided by the number of values. | 4.4 |
| Median | Middle value after arranging the values in order. | 5 |
| Mode | Most frequently occurring value. | 5 |
14. Working with Economic Data
Suppose nine learners report the following costs for their mobile phones:
| Student | Cost of Mobile Phone (GH₵) |
|---|---|
| A | 570 |
| B | 527 |
| C | 559 |
| D | 1,800 |
| E | 500 |
| F | 420 |
| G | 400 |
| H | 420 |
| I | 430 |
There are 9 class members in the data set.
The stated statistical results are:
- Mode = GH₵420
- Mean = GH₵703.25
- Median = GH₵500
15. Understanding an Outlier
An outlier is a value that differs significantly from the other values in a data set.
In the mobile-phone data, GH₵1,800 is an outlier because it is much higher than most of the other costs.
An outlier can affect an average substantially. In particular, a very high value can make the mean much larger, while a very low value can make the mean much smaller.
16. Why Can the Median Be More Useful?
When a data set contains a large outlier, the mean can be pulled away from most of the observations.
The median identifies the middle value and may therefore give a better indication of the typical value when the data contains an unusually high or low observation.
For the mobile-phone data, the median of GH₵500 better describes the cost for a class member because the mean is higher than most of the costs in the data set.
17. Applying Graphs to Data
Data can be presented visually after it has been organised in a table.
A graph can help you see differences between values and identify patterns more quickly.
When plotting data:
- identify the variables;
- choose an appropriate scale;
- label the axes;
- plot the values accurately; and
- give the graph a clear title.
18. Why Economists Use Tools
Economic tools help transform information into forms that can be examined and interpreted.
Words can communicate ideas. Tables can organise data. Graphs and charts can reveal relationships visually. Statistical measures can summarise data. Mathematical models can express relationships more precisely, while software applications can support analysis.
The tools therefore complement one another.
19. Fundamental Economic Concepts
Economic analysis is built around several fundamental concepts that explain how individuals, households, businesses and societies make choices.
Six important concepts are:
- wants;
- means;
- scarcity;
- choice;
- scale of preference; and
- opportunity cost.
20. Wants
Wants are the desires or preferences individuals have for goods, services or experiences that they believe will satisfy their needs or provide utility and satisfaction.
Wants can differ from one person to another. They can also change according to circumstances and preferences.
21. Means
Means refer to the resources or assets that individuals or societies have at their disposal to achieve their goals or satisfy their wants.
The means available to a person or society place limits on what can be achieved at a particular time.
22. Scarcity of Resources
Scarcity refers to the limited availability of resources relative to the demand for them.
Scarcity exists because available resources cannot satisfy all competing wants and needs.
Scarcity is therefore the condition that makes economic choice necessary.
23. Choice
Choice is the decision-making process individuals, households, businesses and societies undergo when allocating scarce resources among competing wants and needs.
When resources are limited, selecting one use means that other uses may not receive the same resources.
24. Scale of Preference
A scale of preference is an individual’s ranking of various wants or desires in order of importance or priority.
It helps a person decide which wants should receive attention first when available means cannot satisfy everything.
For example, a learner may rank several wants from the most important to the least important before deciding how to use limited resources.
25. Opportunity Cost
Opportunity cost is the cost of choosing one thing over another.
Whenever a choice is made between competing alternatives, the decision involves giving up another option.
Understanding opportunity cost helps us recognise that choices have consequences.
26. How the Concepts Connect
The six concepts form a logical chain:
Wants → Limited Means → Scarcity → Choice → Scale of Preference → Opportunity Cost
People have wants. Their means are limited. This creates scarcity. Scarcity requires choice. A scale of preference helps rank competing wants. When one option is chosen over another, there is an opportunity cost.
27. A Simple Everyday Example
Imagine having limited resources but several things you would like to obtain.
You first identify your wants. You then consider your available means. Because those means are limited relative to your wants, scarcity exists.
You must then make a choice. To guide that decision, you arrange your wants according to a scale of preference. The option you give up when you choose another represents the opportunity cost.
28. Role-Play the Concepts
Economic concepts can be understood more deeply through role-play.
Take roles that represent different economic situations and dramatise the concepts of:
- want;
- means;
- scarcity;
- choice;
- scale of preference; and
- opportunity cost.
Before performing, understand the objectives, constraints and economic ideas connected with your assigned role.
29. Collaborative Problem-Solving
Work in small groups to identify societal problems and arrange them in order of importance.
Then consider how limited resources could be allocated to address those problems.
Explain why some problems receive higher priority than others and identify the opportunity cost associated with the choices made.
30. Using Economic Tools to Solve Problems
Economic tools become more meaningful when they are applied to real problems.
A table may organise information about a problem. A graph may reveal a relationship. A statistical measure may summarise the data. Words can explain the findings, while mathematical tools can help express relationships.
The appropriate tool depends on the type of information and the question being investigated.
31. Practice: Identify the Tool
Question: Which tool is especially useful for displaying an economic relationship visually?
Answer: A graph.
Question: Which tool arranges information in rows and columns?
Answer: A table.
Question: Which three measures of central tendency are introduced in this lesson?
Answer: Mean, median and mode.
Question: Name four types of charts.
Answer: Bar chart, line chart, pie chart and pictogram.
32. Practice: Fruit Data
Question: What is the total frequency in the fruit data?
Answer: 40.
Question: How many fruit categories are represented?
Answer: 9.
Question: What is the mean?
Answer: 40 ÷ 9 = 4.4 approximately.
Question: What is the median?
Answer: 5.
Question: What is the mode?
Answer: 5.
33. Practice: Outliers
Question: What is an outlier?
Answer: An outlier is a value that differs significantly from the other values in a data set.
Question: What is the outlier in the mobile-phone data?
Answer: GH₵1,800.
Question: How can an outlier affect the mean?
Answer: A high outlier can make the mean much larger, while a low outlier can make it much smaller.
34. Practice: Fundamental Concepts
Question: What are wants?
Answer: Wants are desires or preferences for goods, services or experiences believed to provide satisfaction or utility.
Question: What are means?
Answer: Means are the resources or assets available to individuals or societies to achieve goals or satisfy wants.
Question: What is scarcity?
Answer: Scarcity is the limited availability of resources relative to demand for them.
Question: What is choice?
Answer: Choice is the decision-making process involved in allocating scarce resources among competing wants and needs.
Question: What is a scale of preference?
Answer: It is a ranking of wants or desires according to importance or priority.
Question: What is opportunity cost?
Answer: Opportunity cost is the cost of choosing one thing over another.
35. Strategic Thinking
Question: Why does scarcity make choice necessary?
Answer: Resources are limited relative to competing wants and needs. Because all wants cannot be satisfied with the available resources, individuals and societies must decide which uses should receive priority.
36. Applying a Scale of Preference
Question: Why is a scale of preference useful when resources are limited?
Answer: It helps an individual rank competing wants according to importance or priority. This makes it easier to decide which wants should be satisfied first.
37. Connecting Choice and Opportunity Cost
Question: Why does choice create opportunity cost?
Answer: Choosing one option over another means giving up the alternative. The cost associated with choosing one thing over another is the opportunity cost.
38. Extended Thinking
Consider a societal problem where resources are insufficient to address every need at once.
Identify the competing wants, describe the available means, explain the scarcity involved and construct a scale of preference showing which needs should receive priority.
Then identify the opportunity cost of the choice made.
39. Review Questions
1. What are economic tools?
Answer: They are analytical methods, models and techniques used to study, analyse and understand economic phenomena.
2. Mention five economic tools.
Answer: Words, graphs, charts, tables and statistical measures such as mean, median and mode. Mathematical models and software applications are also economic tools.
3. What is the difference between mean, median and mode?
Answer: The mean is the sum of values divided by the number of values; the median is the middle value when values are arranged in order; and the mode is the value occurring most frequently.
4. What is an outlier?
Answer: An outlier is a value that differs significantly from the other values in a data set.
5. Define scarcity.
Answer: Scarcity is the limited availability of resources relative to demand for them.
6. What is a scale of preference?
Answer: It is an individual’s ranking of wants or desires according to importance or priority.
7. Define opportunity cost.
Answer: Opportunity cost is the cost of choosing one thing over another.
40. Final Synthesis
Economics requires a clear language for understanding economic relationships and problems. Words, graphs, charts, tables, mathematics, statistics and software applications provide different ways of communicating and analysing economic information.
Statistical tools help summarise data through measures such as the mean, median and mode. An outlier can influence averages and therefore needs to be recognised when interpreting data.
Economic thinking also begins with human wants and the means available to satisfy them. Since means are limited relative to competing wants, scarcity exists. Scarcity requires choice, a scale of preference helps establish priorities, and every choice can involve an opportunity cost.
These ideas connect analytical tools with real economic decision-making.
Access NaCCA-aligned Support Packs
Download your structured NaCCA-aligned Teacher Support Pack and Student Learning Pack, designed for clarity, practicality, and reliable teaching and learning.