
Economic Tools and Fundamental Economic Concepts Explained for SHS 1 Economics (Sem. 1 – Week 2)
Economics is not studied through words alone. An economist needs ways to organise information, reveal relationships, measure patterns and communicate conclusions.
That is where economic tools become important.
From a simple table of data to a graph, from an average to a mathematical model, each tool provides a different way of looking at economic information.
How Economists Make Information Understandable
Economic tools are analytical methods, models and techniques used to study, analyse and understand economic phenomena.
Economic analysis involves examining data, theories, models and policies to understand how economic systems function, predict future outcomes and evaluate the effects of decisions and interventions.
The tools used for this purpose include words, graphs, charts, tables, averages, mathematics and software applications.
Words Can Shape Economic Understanding
Words may seem less technical than graphs or statistics, but they are essential to Economics.
Economists, policymakers, advertisers, journalists, educators and individuals use language to communicate economic concepts, formulate policies, influence behaviour and facilitate economic transactions.
Careful economic communication can affect market sentiment, consumer choices, investment decisions, policy debates and public understanding.
Seeing Relationships Through Graphs
Some economic relationships become easier to understand when they are represented visually.
Graphs simplify complex relationships and help communicate economic ideas, theories and findings.
Examples include:
- supply and demand curves;
- production possibility curves;
- market structure diagrams; and
- cost curves.
A graph allows the reader to see patterns and relationships rather than relying entirely on written explanation.
Charts Tell a Visual Story
Charts are another way of presenting economic information.
Bar charts, line charts, pie charts and pictograms can organise information visually and make comparisons or patterns easier to recognise.
The usefulness of a chart depends on choosing a form that matches the information being presented.
Tables Preserve the Details
A table arranges information in rows and columns.
Unlike a visual summary that may emphasise a pattern, a table can preserve the individual values themselves. This makes tables particularly useful when exact figures need to be examined or compared.
Statistics Give Data Meaning
Economic data often contains many observations. Statistical tools help economists make sense of those observations.
They can be used to identify patterns, relationships and trends, support decisions, inform policy recommendations, forecast economic developments and evaluate interventions.
Mean, Median and Mode
Three important measures of central tendency are the mean, median and mode.
| Measure | What It Tells You |
|---|---|
| Mean | The total of the values divided by the number of values. |
| Median | The middle value after the data is arranged in order. |
| Mode | The value occurring most frequently. |
A Class of 40 Learners and Fruit Distribution
Consider the distribution of different fruits among 40 SHS 1 learners:
| Fruit | Frequency |
|---|---|
| Orange | 4 |
| Mango | 5 |
| Banana | 4 |
| Pear | 5 |
| Pawpaw | 5 |
| Coconut | 5 |
| Watermelon | 5 |
| Pineapple | 5 |
| Sheanut | 2 |
The total frequency is 40, while there are nine fruit categories.
Therefore:
Mean = 40 ÷ 9 = 4.4 approximately.
When the frequencies are arranged in ascending order, we get:
2, 4, 4, 5, 5, 5, 5, 5, 5
The middle value is 5, so the median is 5.
The value 5 occurs six times, making 5 the mode.
Why Median and Mode Can Agree
Median and mode answer different questions.
The median asks, “What is the middle value?”
The mode asks, “Which value occurs most often?”
In this data set, both answers happen to be 5. Their agreement does not mean that the two measures have the same definition.
When an Average Can Mislead
Consider a set of mobile-phone costs reported by nine learners:
| Student | Phone Cost (GH₵) |
|---|---|
| A | 570 |
| B | 527 |
| C | 559 |
| D | 1,800 |
| E | 500 |
| F | 420 |
| G | 400 |
| H | 420 |
| I | 430 |
The mode is GH₵420, while the median is GH₵500. The stated mean is GH₵703.25.
The striking figure is GH₵1,800. It is far above most of the other observations.
Understanding Outliers
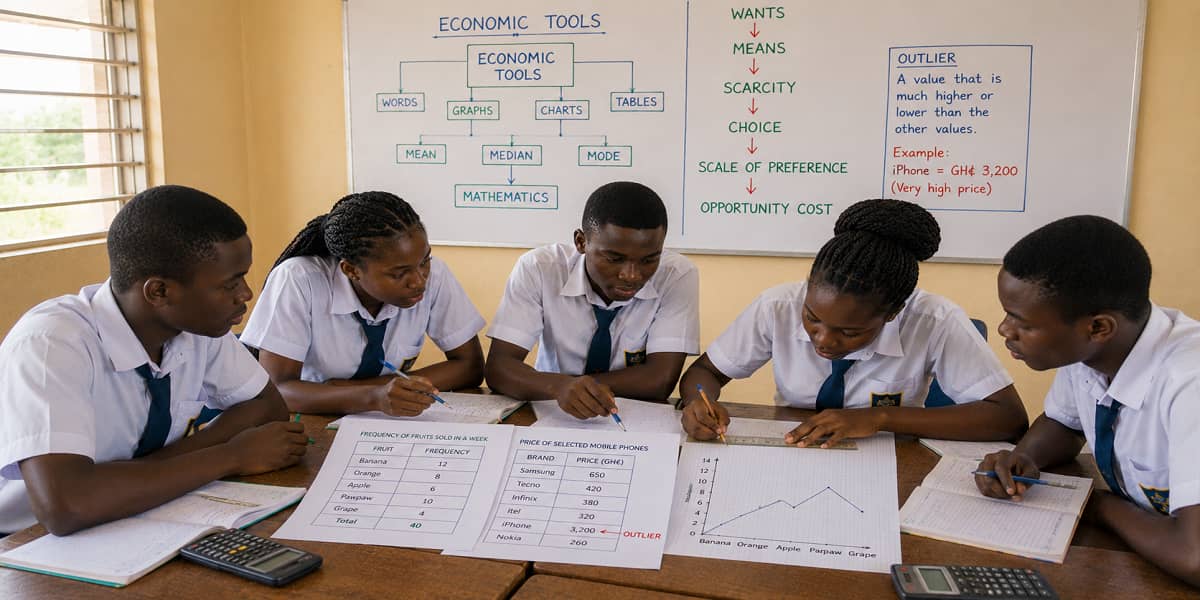
An outlier is a value that varies significantly from the other values in a data set.
Outliers matter because they can distort averages. A very large value can pull the mean upward, while a very small value can pull it downward.
This is why the median can sometimes provide a better description of a typical observation when a data set contains a substantial outlier.
In the phone-cost example, the median better describes the cost for a class member because the mean is higher than most of the costs in the data set.
Economic Analysis Is More Than Calculation
Calculating an average is only part of economic analysis.
The more important question is often: What does the number tell us?
A statistic becomes useful when it helps us understand a pattern, compare situations, identify a relationship or make an informed decision.
This is why economists need both numerical skills and interpretation.
From Economic Tools to Economic Choices
The tools used to analyse information connect naturally with the fundamental ideas of Economics.
At the centre of economic life are wants, the means available to satisfy them and the resulting problem of scarcity.
Wants and Means
Wants are desires or preferences for goods, services or experiences believed to provide satisfaction or utility.
Means are the resources or assets available to individuals or societies for achieving goals or satisfying wants.
The relationship between the two creates an important economic tension: wants can compete for resources that are limited.
Scarcity Creates the Need for Choice
Scarcity means that resources are limited relative to the demand for them.
Because resources cannot satisfy every competing want and need at the same time, decisions must be made.
Choice is therefore the decision-making process involved in allocating scarce resources among competing wants and needs.
The Scale of Preference
How should competing wants be prioritised?
A scale of preference provides an answer. It is an individual’s ranking of wants or desires according to importance or priority.
Ranking wants makes it easier to determine which ones should receive available resources first.
Opportunity Cost: The Other Side of Choice
Every choice between competing alternatives involves giving something up.
Opportunity cost is the cost of choosing one thing over another.
This concept reminds us that a choice has consequences. When one alternative is selected, another alternative is not selected with the same resources.
The Six Concepts in One Picture
| Concept | Central Question |
|---|---|
| Wants | What do people desire? |
| Means | What resources are available? |
| Scarcity | Are the resources sufficient for all competing wants? |
| Choice | Which use of the scarce resources should be selected? |
| Scale of preference | Which wants have greater priority? |
| Opportunity cost | What is given up when one option is chosen? |
Economic Thinking in a Community
The same reasoning can be applied beyond individual households.
A community may face several important problems while having limited resources available to address them.
Members can identify the problems, rank them according to importance and consider how available resources should be allocated.
The decision involves scarcity, choice, priority and opportunity cost.
Why Economic Tools Matter Here
Economic tools can help people make such decisions more systematically.
Data can be organised in tables. Patterns can be displayed through graphs and charts. Statistical measures can summarise information. Words can communicate the findings, while mathematical models can help express relationships.
The tools do not make the decision automatically. They provide information that can improve analysis and understanding.
Learning Through Role-Play
The concepts of wants, means, scarcity, choice, scale of preference and opportunity cost can be explored through dramatic role-play.
A role-play can place learners in situations where they have different objectives and limited resources. Participants then have to make decisions and explain the economic reasoning behind them.
This makes abstract concepts easier to connect with real decision-making.
From Performance to Analysis
Role-play becomes more useful when learners move beyond acting and discuss what happened.
After a scenario, ask:
- What were the competing wants?
- What means were available?
- Where did scarcity arise?
- What choice was made?
- How were priorities established?
- What was the opportunity cost?
Building Stronger Economic Judgement
Economic analysis requires more than identifying a concept. It requires explaining how the concept operates in a real situation.
For example, saying “there is scarcity” is only the beginning. A stronger analysis identifies the limited resource, the competing wants and the resulting choice.
Similarly, identifying an outlier is only the beginning. A stronger analysis explains how the outlier affects the interpretation of the data.
Try This Challenge
Imagine a community has limited resources but several important societal problems.
Rank the problems from highest to lowest priority. Explain your ranking and decide how the available resources should be allocated.
Then identify what is sacrificed as a result of the chosen allocation.
This single exercise brings together wants, means, scarcity, choice, scale of preference and opportunity cost.
The Bigger Picture
There is a close relationship between the tools of Economics and the concepts they help us understand.
Tools help us examine information.
Economic concepts help us interpret the decisions people and societies make.
Together, they support clearer economic reasoning.
Key Ideas to Remember
- Economic tools are methods, models and techniques used to analyse economic phenomena.
- Words communicate economic ideas and can influence behaviour and economic outcomes.
- Graphs and charts make relationships and patterns easier to see.
- Tables organise information systematically.
- Mean, median and mode are measures of central tendency.
- An outlier is a value that differs significantly from other values in a data set.
- Wants are desires or preferences for goods, services or experiences.
- Means are the resources or assets available to satisfy wants or achieve goals.
- Scarcity occurs when resources are limited relative to demand.
- Choice involves allocating scarce resources among competing wants and needs.
- A scale of preference ranks wants according to importance.
- Opportunity cost is the cost of choosing one thing over another.
Final Takeaway
Economic understanding depends on two abilities: analysing information and understanding choices.
Graphs, charts, tables, statistics, mathematics and words provide different ways to examine economic information. Measures such as mean, median and mode help summarise data, while recognising outliers helps prevent misleading interpretations.
At the same time, economic life is shaped by wants, limited means and scarcity. Scarcity creates the need for choice; a scale of preference helps establish priorities; and opportunity cost reminds us that choosing one option means giving up another.
Good economic thinking connects evidence with decisions.
Access NaCCA-aligned Support Packs
Download your structured NaCCA-aligned Teacher Support Pack and Student Learning Pack, designed for clarity, practicality, and reliable teaching and learning.