Total, Average and Marginal Revenue Curves – SHS 2 Economics (S1 W10)
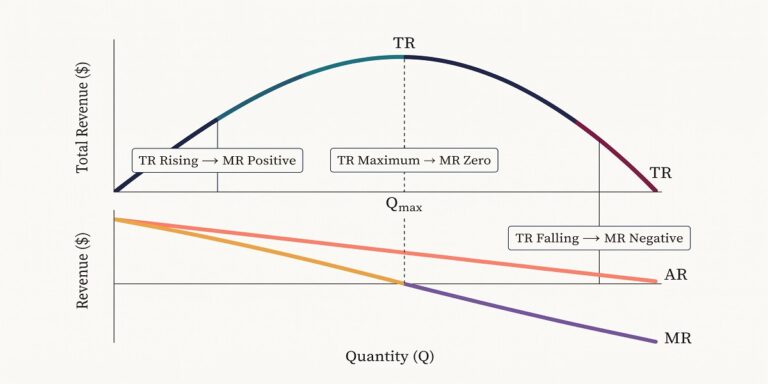
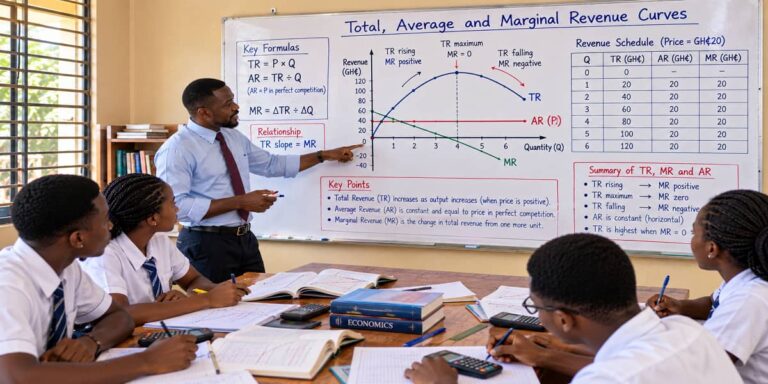
Total, Average and Marginal Revenue Curves Explained for SHS 2 Economics (Sem. 1 – Week 10) A table of revenue figures tells us what happens at different quantities. A graph allows us to see the pattern. This is the purpose of revenue curves: they turn TR, AR and MR data into relationships that can be…