Applications Of Proportions
Introduction
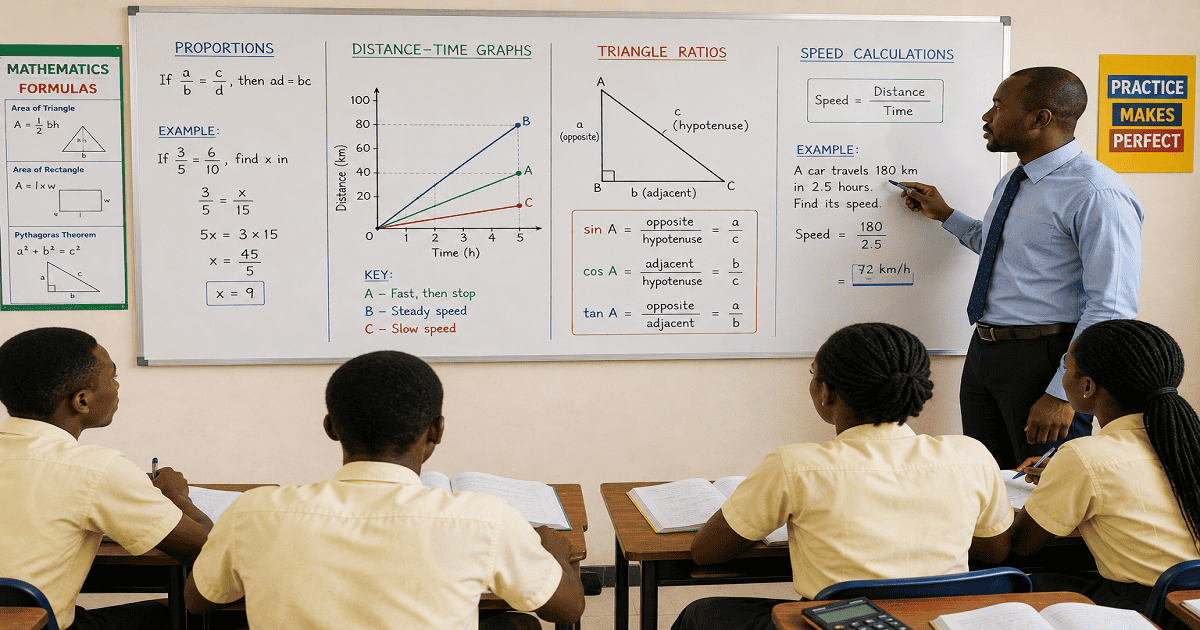
Proportions compare two equal ratios or rates. They are important in mathematics because they help solve problems involving angles, similar figures, speed, and real-life situations such as mixing paint colours and interpreting distance-time graphs. Proportions are also closely linked to Pythagoras’ theorem and trigonometric ratios.
Key Concepts
- Proportion: A comparison showing that two ratios or rates are equal.
- Equivalent Proportions: Proportions that represent the same relationship even if written differently.
- Gradient: The slope of a graph representing change in distance over time.
- Distance-Time Graph: A graph showing distance travelled against time.
- Pythagoras’ Theorem: A relationship in right-angled triangles where a2 + b2 = c2.
- Trigonometric Ratios: Ratios involving sine, cosine, and tangent in right-angled triangles.
Explanation
Proportions are used to compare ratios in mathematics and everyday situations. Equivalent proportions can be observed in similar triangles and other geometric figures.
In triangles with angles 30°, 60°, and 90°, the ratio of the interior angles is 1 : 2 : 3. The corresponding ratio of the side lengths is 1 : √3 : 2.
For triangles with angles 45°, 45°, and 90°, the ratio of the interior angles is 1 : 1 : 2, while the ratio of the side lengths is 1 : 1 : √2.
Pythagoras’ theorem is used to relate the sides of a right-angled triangle:
a2 + b2 = c2
For example, in a triangle with sides 3, 4, and 5:
32 + 42 = 52
Trigonometric ratios are also based on proportions in right-angled triangles:
- sinθ = Opposite / Hypotenuse
- cosθ = Adjacent / Hypotenuse
- tanθ = Opposite / Adjacent
Proportions can be applied in practical situations such as mixing paint colours. If a painter mixes yellow and blue paint in the ratio 3 : 1, every 3 parts of yellow requires 1 part of blue.
Distance-time graphs are graphs that show how distance changes over time. Distance is represented on the vertical axis while time is represented on the horizontal axis.
The gradient of a distance-time graph represents speed:
Gradient = Change in distance / Change in time
A steeper gradient means a higher speed, while a gentler gradient represents a lower speed. A horizontal line means the object is stationary because there is no change in distance.
Applications Of Ratios And Proportions
| Application | Ratio/Formula | Description |
|---|---|---|
| 30° : 60° : 90° Triangle | 1 : 2 : 3 | Ratio of interior angles |
| 45° : 45° : 90° Triangle | 1 : 1 : 2 | Ratio of interior angles |
| Pythagoras’ Theorem | a2 + b2 = c2 | Relationship between sides of right triangles |
| Gradient | Distance / Time | Represents speed on graphs |
| Trigonometric Ratios | sin, cos, tan | Ratios in right-angled triangles |
Distance-Time Graph Interpretation
| Graph Feature | Observation | Conclusion |
|---|---|---|
| Steep Line | Large change in distance over short time | High speed |
| Gentle Slope | Small change in distance over longer time | Low speed |
| Horizontal Line | No change in distance | Object is stationary |
| Curved Line | Changing gradient | Changing speed or acceleration |
Examples
Example 1
Problem: A painter uses 12 litres of yellow paint in a ratio of 3 : 1 for yellow to blue paint. Find the amount of blue paint needed.
- The ratio of yellow to blue is 3 : 1.
- 3 parts correspond to 12 litres.
- 1 part = 12 / 3 = 4 litres.
- Therefore, blue paint required is 4 litres.
Final Answer: 4 litres of blue paint are required.
Example 2
Problem: A car travels 120 km in 2 hours. Find the average speed.
- Use the formula: Speed = Distance / Time.
- Substitute the values: 120 km / 2 hours.
- Simplify: 60 km/h.
Final Answer: The average speed is 60 km/h.
Application and Activities
- Interpret different distance-time graphs.
- Calculate speed using graph gradients.
- Apply proportions to solve paint mixing problems.
- Use trigonometric ratios in right-angled triangles.
Practice Questions
- Find the speed of an object that travels 180 km in 3 hours.
- Determine the ratio of the angles in a 45° : 45° : 90° triangle.
- Explain how a stationary object appears on a distance-time graph.
Summary
Applications of proportions involve comparing ratios and rates in mathematics and real-life situations. Proportions are used in triangles, trigonometric ratios, paint mixing, and distance-time graphs. The gradient of a distance-time graph represents speed, while horizontal lines indicate stationary objects. Understanding proportions helps learners solve practical mathematical problems involving speed, geometry, and measurement.
Access NaCCA-aligned Support Packs
Download your structured NaCCA-aligned Teacher Support Pack and Student Learning Pack, designed for clarity, practicality, and reliable teaching and learning.